Back to Components 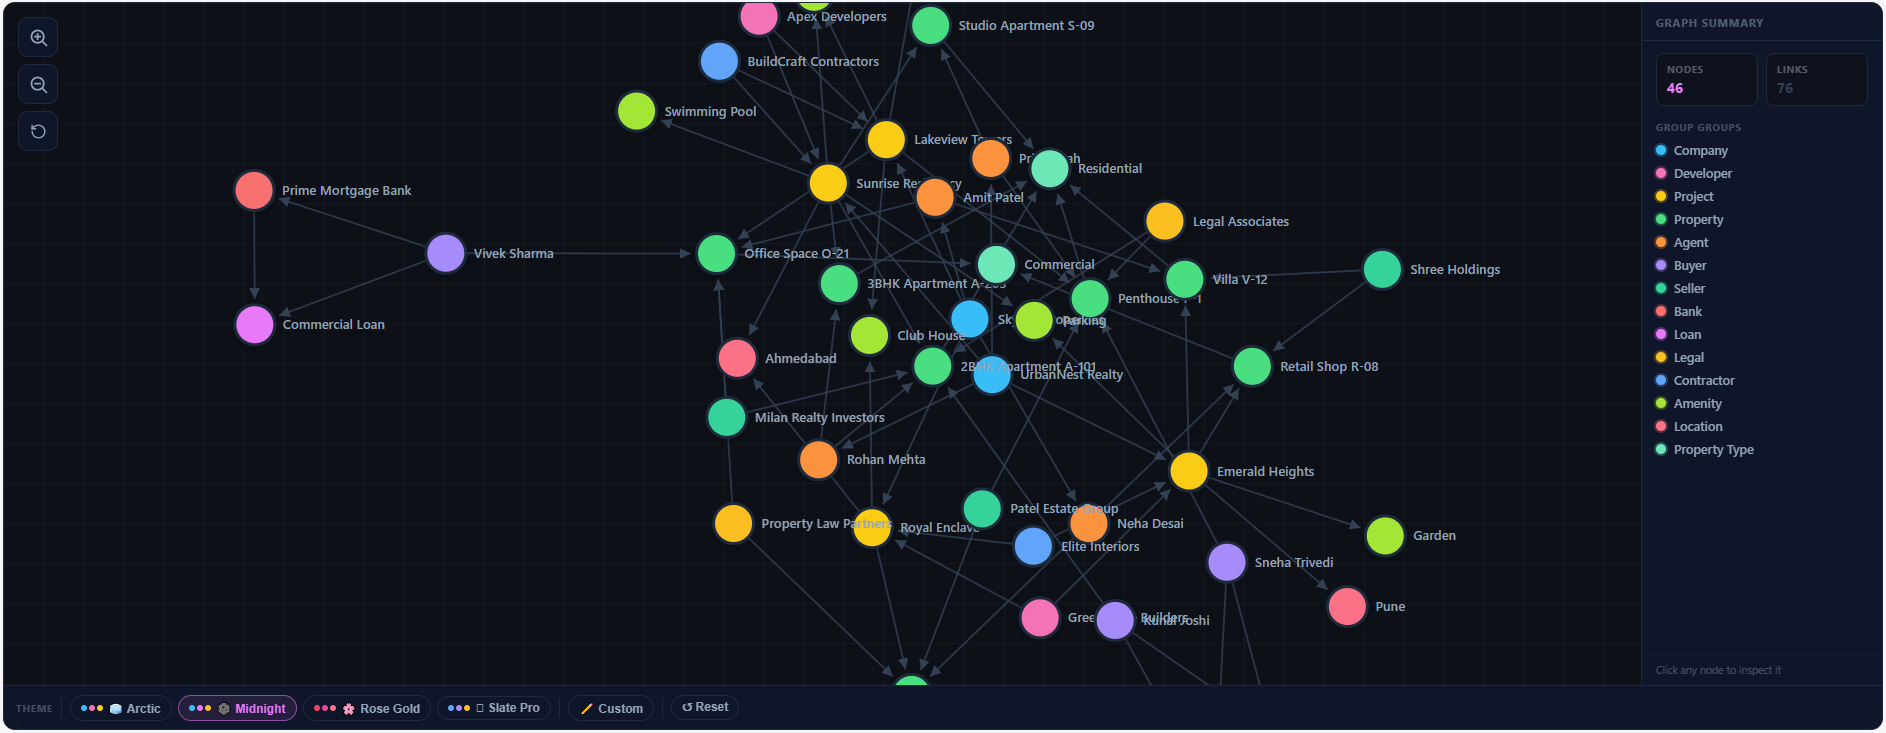
D3 Force Graph
Visualize relationships between data nodes using an interactive force-directed graph.
ABOUT THIS COMPONENT
D3 Force Graph shows how records connect to each other, as a force-directed graph you can drag and zoom. It is ideal for network analysis, organizational charts, and relational datasets. Drag nodes, zoom in, and click through to the records behind them.
KEY FEATURES
Force-directed graph visualization
Interactive nodes and edges
Dynamic relationship mapping
Zoom and drag support
Ideal for network and relational data

Need a custom Retool component?
We build custom Retool components to order, and full Retool apps as an Official Retool Agency Partner. Book a free 30-minute call and we’ll follow up with a fixed-scope estimate.